
Boost SEO with Effective Infographic Design
Content Marketing, Infographic Design, SEO
Infographic Design That Actually Moves the Needle: How KJDM Turns Data into SEO Fuel
If your content isn’t getting shared, linked, or remembered, you’re leaving money on the table. Strategic, brand-consistent infographics change that fast—and KJDM builds them to drive real SEO and marketing results, not just to “look pretty.”
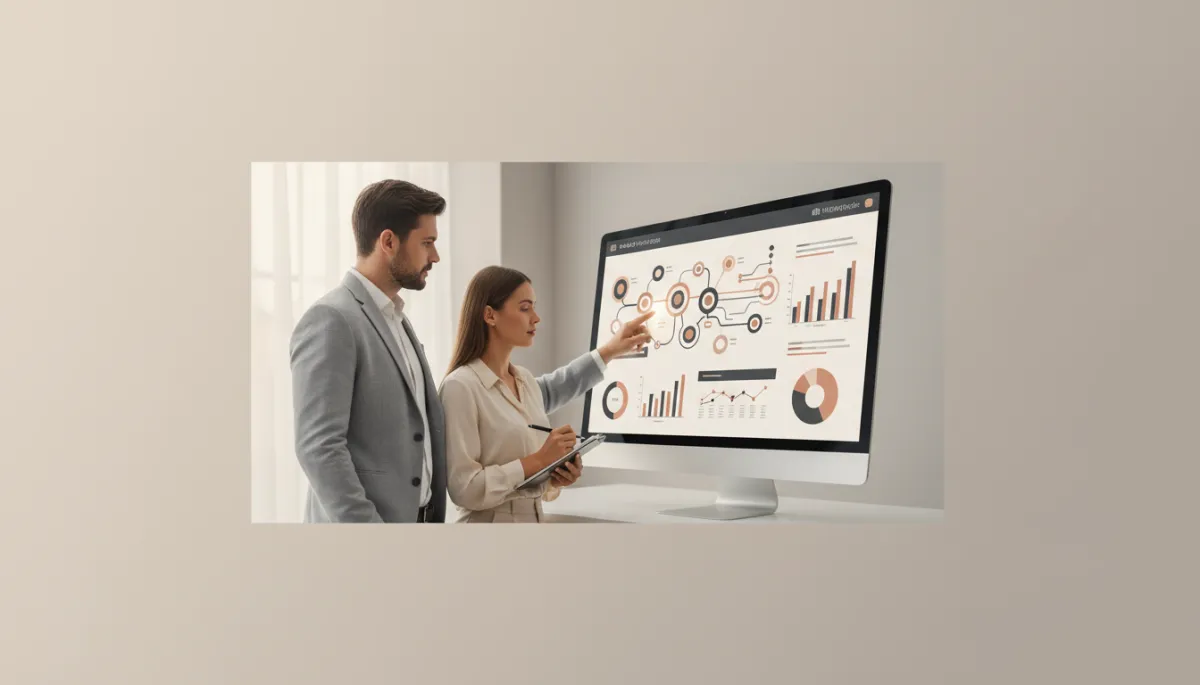
Why Infographics Dominate Shares: Your Audience’s Brain Is Wired for Them
People are drowning in text. Your prospects skim, scroll, and forget. But they stop for strong visuals—especially when those visuals make complex information instantly clear. That’s exactly why infographics are consistently among the most shared content formats on the internet.
Visual data isn’t just “nice to have.” Studies show that the brain processes visual information up to 60,000 times faster than text. That’s not a small edge; that’s a complete advantage. When you compress a 1,500-word article’s worth of insight into a single, scannable graphic, you’re respecting your audience’s time and attention—and they reward you with clicks, saves, and shares.
Marketers and business owners who understand this stop fighting for attention with yet another wall of copy. They deploy data-rich, brand-consistent infographics that explain a process, break down research, or compare options in seconds. That’s what gets reposted in Slack channels, embedded in blog posts, and cited in newsletters. That’s how your brand travels further than your ad budget ever could.
One Strong Infographic, Dozens of Natural Backlinks
You can grind for backlinks with cold outreach—or you can publish something so useful other sites choose to link to you. A well-designed infographic is one of the most efficient ways to earn those natural links at scale. Search and content marketing experts have been clear for years: strong infographics attract backlinks and improve domain authority by giving other creators something worth embedding (Search Engine Journal; Forbes).
Here’s how it plays out in the real world:
- You commission a KJDM infographic that visualizes a research study, framework, or step-by-step process in your niche.
- You publish it on your site with an embed code and clear attribution instructions.
- Bloggers, journalists, and other marketers discover it via search, social, or newsletters and use it to illustrate their own content.
- They embed the infographic and link back to your original URL as the source.
That single asset now quietly builds your backlink profile for months or even years. No spammy tactics. No burned relationships. Just compounding SEO value from one strategic piece of content. KJDM designs every infographic with this reality in mind—clear branding, clean attribution, and formats that embed beautifully anywhere.
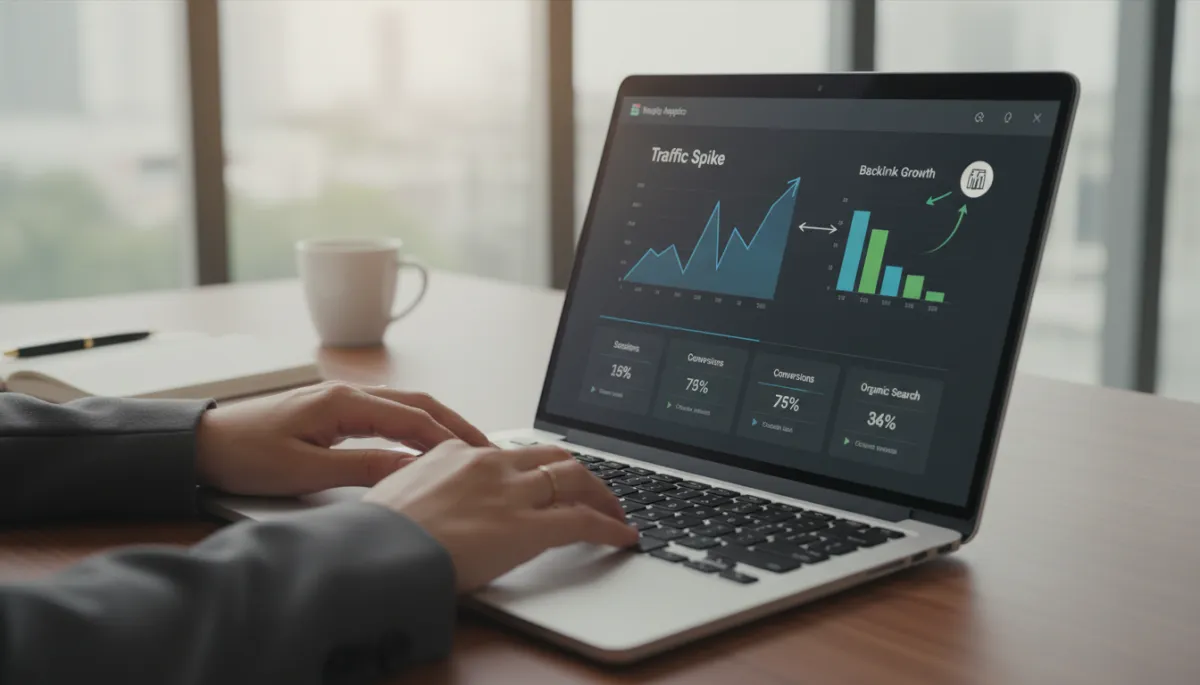
A single strategic infographic can drive new backlinks and traffic long after launch.
Visual Search Is Exploding—Your Infographics Need to Be Findable
Google Images and Pinterest are no longer just “nice extras.” They’re powerful discovery engines. Visual search is rapidly transforming how people research, shop, and learn, with platforms like Google and Pinterest investing heavily in AI-powered image recognition and discovery (Forbes, Pinterest Business).
When your infographic is properly tagged, titled, and described, it doesn’t just sit on your blog. It shows up in:
- Google Images for high-intent keywords in your niche.
- Pinterest search results where users are actively saving ideas and resources.
- Visual search experiences where users start with an image instead of a phrase.
That means your infographic can attract qualified, organic traffic even if someone never types your brand name or article title. But this only works if the asset is built for it. KJDM doesn’t just hand you a pretty PDF and wish you luck. We deliver web-optimized versions with filenames, aspect ratios, and layouts that play nicely with search and social platforms—plus guidance on alt text and pin descriptions so you can capture visual search demand instead of watching competitors take it.
Viral vs. “Just Pretty”: The Real Difference in Infographic Performance
Most infographics fail for a simple reason: they’re built like posters, not like tools. They look nice, but they don’t guide the eye, clarify the story, or make sharing effortless. The infographics that actually take off—on social, in industry roundups, in email newsletters—are engineered differently. They’re ruthless about data hierarchy, clarity, and shareability.
1. Data hierarchy: one core message, not twenty
Viral infographics don’t try to say everything. They choose a single, sharp promise—“The 7-Step Funnel That Tripled Our Leads” or “Where Marketing Budgets Really Go in 2026”—and build a visual hierarchy around it. Big, bold numbers. Clear section headings. Logical flow from top to bottom. This mirrors 2026 design trends that emphasize narrative flow and strong numeric emphasis for readability on mobile (Infographics Designers).
2. Clarity: zero confusion, even on a phone screen
If someone has to zoom in and pinch around just to read your numbers, you’ve already lost them. High-performing infographics use mobile-first typography, clean monochrome or muted earth-tone palettes, and plenty of white space—exactly the direction leading designers are taking for 2026. Every chart, icon, and callout exists to make the idea faster to understand, not to show off design tricks.
3. Shareability: easy to grab, easy to credit
The infographics that spread are easy to share: vertical formats that work on Pinterest and LinkedIn, social snippets that can be cropped into carousels, and clear branding that doesn’t overpower the content. They include your logo and URL, but they don’t scream “ad.” They feel like a resource first, a brand asset second—and that’s why people are comfortable embedding and reposting them.
Viral infographics are engineered for hierarchy, clarity, and effortless sharing from day one.
How KJDM Builds Infographics That Serve Design, SEO, and Marketing Strategy
You’re not buying decoration. You’re buying a strategic asset that should earn attention, links, and leads. KJDM’s infographic design service is built around that reality. For a one-time $297, you get a custom, brand-consistent infographic plus every format you need to deploy it everywhere that matters:
- Data visualization that makes your message unavoidable. We take your raw data, frameworks, or processes and structure them into a clear narrative arc—Problem → Insight → Solution—aligned with 2026 trends in narrative-driven infographics and bold numeric emphasis.
- Print-ready files. Need it on a trade show banner, sales one-pager, or investor leave-behind? You get high-resolution, print-ready formats that hold up in the real world, not just on a screen.
- Web-optimized versions. We deliver compressed, web-friendly files with smart aspect ratios so your infographic loads fast, looks sharp, and behaves well on your website and landing pages—critical for SEO and user engagement metrics (Content Marketing Institute).
- Social media formats. You don’t have time to crop and hack things together. We include tailored formats for platforms like LinkedIn, Instagram, X, and Pinterest so you can launch a full campaign the moment the files hit your inbox.
- Source files included. Unlike many agencies, we’re not holding your design hostage. You get the editable source files, so your team can update numbers, localize content, or spin off new versions as needed.
A design process built for marketers, not designers’ egos
Every KJDM project runs through a simple but sharp process that keeps strategy front and center:
- Discovery and goal-setting. We clarify your primary objective: backlinks, lead generation, sales enablement, brand authority, or all of the above. No vague “make it cool” briefs. Clear targets only.
- Content and data structuring. We organize your information into a logical story, defining the main headline, sub-sections, and key stats. This is where we lock in data hierarchy and narrative flow so the design has a solid backbone.
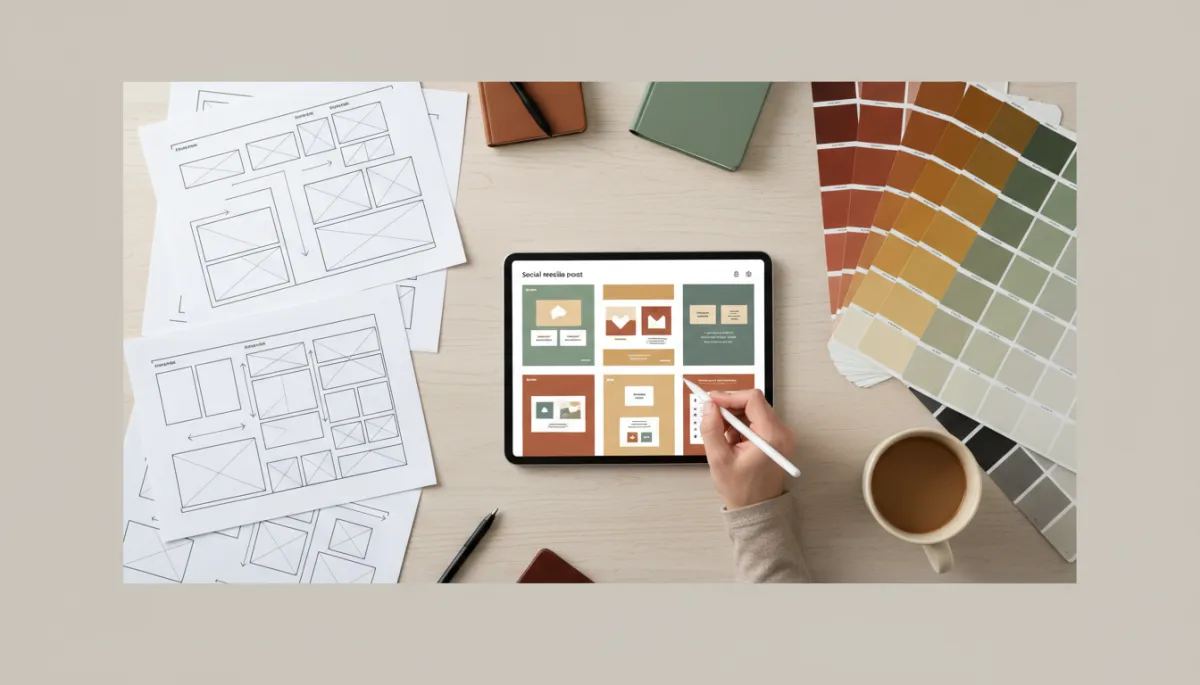
- Brand-consistent visual direction. Using your brand guidelines, we build a palette and typographic system that reflects current 2026 trends—muted earth tones, clean monochromes, mobile-first type—without diluting your identity.
- Design, refinement, and optimization. We design with SEO and shareability in mind from the start: smart dimensions for Pinterest and LinkedIn, space for clear attribution, and layouts that stay legible on smaller screens.
- Delivery with deployment guidance. You don’t just get files; you get practical instructions on how to publish, tag, and promote the infographic to maximize search visibility, social traction, and backlink potential.
Stop Posting Forgettable Content. Put a High-Impact Infographic to Work.
You can keep publishing blog posts that blend into the feed, or you can release a single, sharp infographic that:
- Stops the scroll and actually gets read.
- Earns natural backlinks from other marketers and publishers.
- Shows up in visual search on Google Images and Pinterest.
- Works across your blog, email, social, and sales assets without constant redesign.
For a one-time $297, KJDM delivers a custom, brand-consistent infographic with data visualization, print-ready files, web-optimized versions, social media formats, and full source files. No bloat. No retainers. Just a hard-working asset you can deploy everywhere your audience spends time.
If you’re serious about building shareable content that actually supports your SEO and marketing strategy, stop settling for generic visuals and disposable posts. Order your custom infographic from KJDM today at kljj365.com. Put one strategic, high-impact visual asset to work and let it earn attention, links, and authority for your brand long after launch.