
Boost Conversions with KJDM's Heatmap Subscription
Heatmaps, Conversion Optimization, Website Analytics, KJDM
Stop Wasting Traffic: Turn Clicks into Customers with KJDM’s $126/Month Heatmap Subscription
You are already paying for traffic. Ads, SEO, social, email. But if you are not tracking how real people actually behave on your site, you are flying blind and burning money. KJDM’s Heatmap Subscription at $126/month is built to fix that, fast.

What Heatmaps Are — And Why Every Serious Business Needs Them
A heatmap is a visual analytics tool that shows where users click, move, and scroll on your website, using color to highlight hot (high activity) and cold (low activity) areas. Instead of drowning in numbers, you see behavior as a simple, brutal truth on top of your actual pages. Tools like Hotjar and Crazy Egg popularized this approach because it works: businesses finally see what users really do, not what they assume they do (Hotjar; Crazy Egg).
Here is the harsh reality: the average website converts only around 3.2% of visitors, while top performers hit 10–11% or more (SearchLab). Most companies respond by buying more traffic instead of fixing the leaks. That is backwards. You do not need more visitors until you know why the ones you already have are not converting. Heatmaps expose that gap instantly.
KJDM’s Heatmap Subscription takes the power of heatmaps, layers in session recordings, funnel analysis, A/B insights, and expert monthly recommendations, and turns it into a focused conversion engine for your website or landing pages — for just $126/month. No fluff. No vanity metrics. Just ruthless clarity on what is working and what is not.
The Three Core Heatmaps You Cannot Afford to Ignore
1. Click Maps: Where Attention Turns (or Fails to Turn) into Action
Click maps show exactly where people click on each page. Buttons, links, images, menus, dead zones — you see it all. If your primary call-to-action gets fewer clicks than a random image or your logo, that is not a theory problem. It is a layout problem. Click maps make that painfully obvious, so you can fix it instead of guessing.
- See if visitors are clicking what you want them to click (buy, book, call, register).
- Spot “false affordances” — elements that look clickable but are not, creating frustration and drop-offs.
- Compare desktop vs. mobile clicks to uncover device-specific issues that are quietly killing revenue.
2. Scroll Maps: How Far People Actually Read Before They Bail
Scroll maps show how far down the page users scroll. They reveal the brutal truth: most people do not reach the bottom. If your key offer, pricing, or form is buried below the fold, you are voluntarily hiding money from yourself. Scroll maps show the exact point where attention dies, so you can pull critical content higher and cut the dead weight below.
- Identify the “fold” on different devices and make sure your main CTA sits above it.
- See where engagement drops off and tighten copy, design, or offer flow right at that point.
- Prioritize what deserves top-of-page real estate instead of letting design trends dictate your layout.
3. Movement Maps: The Hidden Story in Mouse Paths and Hesitation
Movement maps (sometimes called hover maps) show where users move their mouse and linger. They highlight confusion, distraction, and interest zones that clicks alone will never reveal. When you see people circling around a section but not clicking, you know something is off — unclear copy, weak offer, or poor visual hierarchy.
- Detect confusing layouts where users hover and hesitate instead of acting.
- See which sections attract attention but fail to convert — perfect targets for copy and design upgrades.
- Understand how visitors visually “scan” your page, so you can guide their eyes to your most profitable elements.
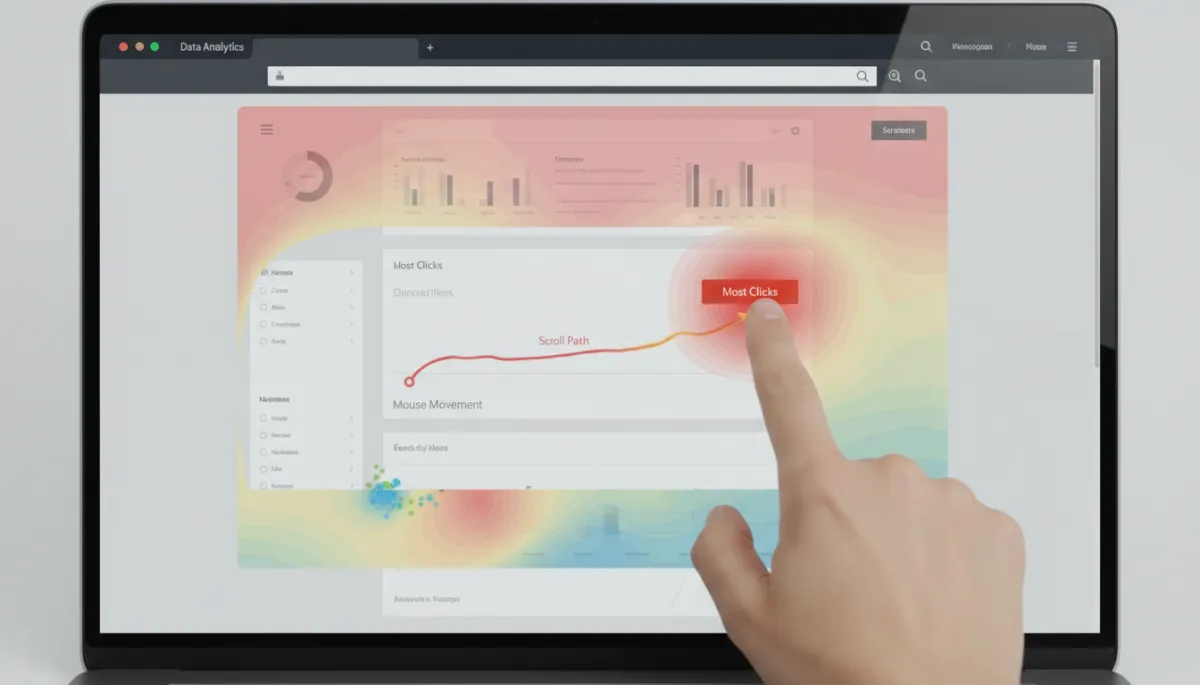
Heatmaps turn vague “user issues” into precise, visual problems you can fix fast.
Session Recordings: Watch Real Users Navigate Your Site, No Excuses
Heatmaps tell you where behavior concentrates. Session recordings show you how it happens. With KJDM’s Heatmap Subscription, you can watch anonymized recordings of real visitors moving through your pages — clicks, scrolls, hesitations, rage clicks, form errors, the lot. It is like sitting behind your customer’s shoulder while they try to buy from you.
You will see users abandon forms because a field is confusing. You will watch them miss your main CTA because it blends into the design. You will see mobile users pinch, zoom, and struggle with elements that looked “fine” on your designer’s 27-inch monitor. Once you have watched ten real sessions, you will never again say “our site is fine” without data to back it up.
Conversion Funnel Analysis: Find Exactly Where Money Leaks Out
A funnel is the path from first visit to conversion: ad click → landing page → product page → cart → checkout → confirmation. Somewhere along that path, people drop off. In fact, cart abandonment alone averages around 70.2% (SearchLab). That is not a small leak. It is a flood.
KJDM’s Heatmap Subscription includes conversion funnel analysis to pinpoint the exact step where visitors bail. Are they bouncing off the landing page? Dropping at the pricing section? Abandoning at the payment details screen? You will not guess. You will know. Then you can attack the right step with targeted design, copy, and UX changes instead of randomly “improving the site.”
A/B Testing Insights Backed by Real Behavior, Not Guesswork
A/B testing without behavior data is just expensive guessing. You can test headlines, colors, layouts, and offers all day, but if you do not understand how people currently behave, your tests will be random and slow to win. Heatmaps and session recordings give you the “why” behind your tests, so your variations are sharp, intentional, and more likely to beat the control.
- Use click maps to decide which buttons, links, or elements deserve priority in your tests.
- Use scroll maps to move key content higher in your A/B variation, where more people actually see it.
- Use movement maps and recordings to simplify sections where people hesitate or rage-click.
KJDM doesn’t just hand you raw data and walk away. The Heatmap Subscription feeds these insights into clear A/B testing ideas you can implement, measure, and scale. No more vague “try a different headline” advice. You get tests grounded in real, observed user behavior.

When tests are driven by behavior data, wins become predictable instead of accidental.
User Behavior Analytics: Beyond Pageviews and Bounce Rates
Traditional analytics tools tell you what happened: pageviews, sessions, bounce rate, time on page. Useful, but shallow. User behavior analytics dig deeper into how and why it happened. That is where real optimization lives. In 2026, the market for heatmap and session-recording software is approaching $4.92 billion and growing at roughly 22% CAGR (BusinessResearchInsights), because smart businesses understand that behavior beats assumptions.
With KJDM’s Heatmap Subscription, you are not just getting pretty visuals. You are getting a behavior analytics engine that reveals:
- Which traffic sources bring visitors who actually engage and buy — not just click and leave.
- How mobile vs. desktop users behave differently, so you can stop treating them as identical.
- Which elements build trust and which trigger doubt or abandonment.
This is the level of clarity you need if you want to join the top 10% of sites converting at 11%+ instead of settling for “industry average.”
Monthly Conversion Optimization Recommendations: Data Is Useless Without Action
Here is where most businesses fail. They install tools, collect data, and then do nothing with it because nobody has time to interpret it. Data without decisions is dead weight. KJDM’s Heatmap Subscription solves this with monthly conversion optimization recommendations tailored to your actual site, your traffic, and your goals.
- Clear, prioritized action steps based on last month’s heatmaps, recordings, and funnel data.
- Specific A/B test ideas, layout changes, copy tweaks, and UX fixes — not vague theory.
- Ongoing tracking to measure impact and stack improvements month after month.
Companies are increasing CRO budgets by roughly 28% because improving conversion is simply more profitable than buying more clicks (SearchLab). At $126/month, KJDM effectively gives you a focused CRO partner for less than you probably waste daily on underperforming ads.

Monthly recommendations turn raw behavior data into a concrete, profitable to-do list.
The Cost of Ignoring Heatmaps vs. $126/Month with KJDM
Let’s be blunt. Most businesses spend thousands every month driving traffic through Google Ads, Meta, SEO retainers, and social campaigns. Yet they never seriously look at why that traffic is not converting. That is reckless. You would not pour water into a leaking bucket and call it a strategy. But that is exactly what you are doing if you scale traffic without fixing conversion.
Heatmaps, session recordings, funnel analysis, and behavior analytics are how you actually find and fix the leaks. KJDM’s $126/month Heatmap Subscription gives you the tools, the insights, and the monthly recommendations to do it consistently. One small lift in conversion — from 2.5% to 3.5%, for example — can easily pay for the service many times over, month after month.
If You Are Serious About Growth, Act Like It
If you are comfortable guessing, hoping, and bleeding ad spend, you do not need heatmaps. But if you are serious about turning your website or landing pages into a reliable revenue engine, you cannot afford to operate blind. The data exists. The tools exist. The only question is whether you will use them before your competitors do.
KJDM’s Heatmap Subscription at $126/month gives you:
- Click, scroll, and movement heatmaps on your key pages.
- Session recordings that show real users navigating your site.
- Conversion funnel analysis to find exactly where visitors drop off before buying.
- Behavior-driven A/B testing insights and user behavior analytics.
- Monthly conversion optimization recommendations you can act on immediately.
Stop paying for traffic that disappears without explanation. See what is really happening on your site. Fix the leaks. Increase conversions. Then scale with confidence, not hope.
Ready to stop guessing and start optimizing? Subscribe to KJDM’s Heatmap Subscription today at kljj365.com and turn your existing traffic into measurable, consistent revenue.